
Facility type: MOLAB
Access provider: Ormylia Foundation, Ormylia Art Diagnosis Centre
Title: Spectroscopic material characterization
Description
Different emitted bands and different scattering phenomena are known to induce different radiation-matter interaction mechanisms, mostly associated with the molecular or the atomic structure and properties of the sample, as well as the surface features of the sample. The basic modalities for electromagnetic spectroscopy are the Fourier Transform Infrared (FTIR) spectroscopy/scanning, the Raman or inelastic spectroscopy, the Ultraviolet (UV)/ Visual (VIS) scanning, and the X-Ray Fluorescence (XRF).
The different modalities are related to different properties of matter, thus, utilizing all of them provides great versatility for investigating and recognizing material types. Icon scanning for material identification is performed by examining and comparing measurements from the Raman, FTIR and XRF spectrometers, or from the mechanisms of inelastic scattering, absorption and fluorescence, respectively. Specifically, the Raman and FTIR modalities serve as the basic tools for recognizing organic and inorganic components, and after identifying the compounds, the XRF modality extracts the element composition.
Services
To develop technological research for the study and documentation of cultural heritage with the support of the State and university departments; improve technology and design devices for the continuous upgrading of laboratory infrastructure and the methodology used; work towards the protection and documentation of art and cultural heritage; provide authenticity certificates and evaluate the state and pathology of the works in order to support and scientifically document necessary conservation works.
- FTIR Spectroscopy is used to take arrays of successive scans to perform spectroscopic mapping imaging for small regions of the tested icons. This way, IR images can be created containing the spectral information for each scanned point.
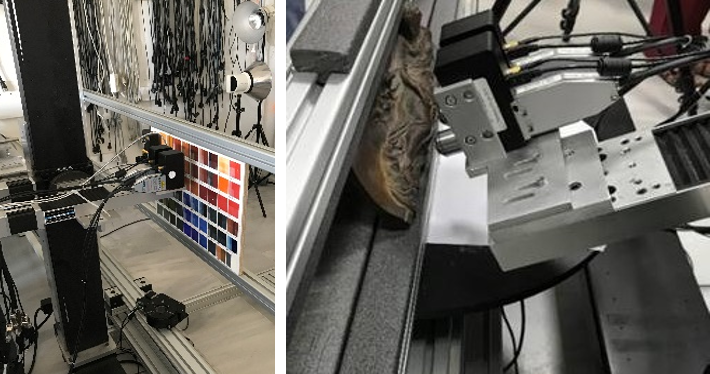
- UV-VIS Spectroscopy (Visible Spectrum Imaging/Colourimetry) is the mapping of physical properties, e.g. color and distribution in an area of interest, in contrast to FTIR and Raman spectroscopy investigating chemical/molecular properties. This spectroscopy provides information only from the surface of an object, as the corresponding wavelengths do not have the ability to penetrate. It can retrieve colour properties on a reference standard (i.e. colour checker) or in the painted stratigraphies in general, as well as the existence of admixtures materials on the painting’s surface. The UV/VIS spectra from several points on the tested item can be acquired and transformed into colour again via the sRGB standard, afterwards. This way, the reconstructed colour is directly compared with the original one from the respective icon.
- Raman spectroscopy is a technique that determines vibrational modes of molecules, while rotational and other low-frequency modes of systems may also be observed. It is commonly used in chemistry to provide a structural fingerprint by which molecules can be identified. Raman spectroscopy originates from the inelastic scattering of a photon by molecules which are excited to higher vibrational or rotational energy levels.
- X-ray fluorescence (XRF) is the emission of characteristic “secondary” (or fluorescent) X-rays from the material that has been excited by high-energy X-ray bombardment. This technique can be used mainly to determine the elemental composition of a sample and, secondarily, for its crystalline structure. XRF is utilised to evaluate the respective findings from the above modules.
Technical Info
FTIR
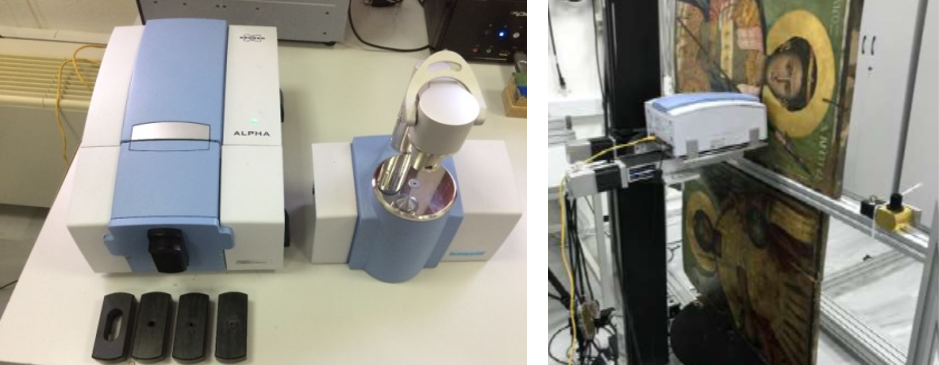
- Bruker ALPHA – IR Spectroscopy (Reflectance, Transmittance-Absorbance and ATR/FTIR systems / IR-CUBE)
- Spectral range: 375 – 7,500 cm-1, (with standard KBr beamsplitter)
- Signal-to-noise ratio: typically >50,000:1 (1 min measurement time, spectral resolution 4 cm-1)
- Spectral resolution: better than 2 cm-1, optional better than 0.8 cm-1 resolution freely adjustable from 0.8 cm-1 to 256 cm-1
- Wavenumber accuracy: 0.05 cm-1 at 2,000 cm-1
- Wavenumber presicion: 0.0005 cm-1 at 2,000 cm-1 (SD of 10 repeat measurements)
- Photometric accuracy: better than 0.1 % T
- Temperature stability 100% line: <1% per °C
UV-VIS
- AVANTES AvaLight-D(H)-S Deuterium-Halogen Light Sources
https://www.avantes.com/products/light-sources/item/237-avalight-d-h-s-deuterium-halogen-light-sources - AVANTES AvaSpec-ULS2048LTEC
https://www.avantes.com/products/spectrometers/sensline/item/333-avaspec-uls-tec
Raman Spectroscopy
- BWTEK i-Raman EX – laser source 1064nm
https://bwtek.com/products/i-raman-ex/ - BWTEK BAC101 Industrial Raman Probe 785nm and 1064nm
https://bwtek.com/products/bac101/
XRF
- ThermoFischer Scientific – Niton XL3t GOLDD+ XRF Analyzer
https://www.thermofisher.com/order/catalog/product/XL3TGOLDDPLUS#/XL3TGOLDDPLUS - ThermoFischer Scientific Portable Test Stand, XL3
https://portables.thermoscientific.com/parts/portable-test-standxl3
Examples/Photos
|
|
|
Related Publications
-
-
- S. Amanatiadis, E. Tsardaka, Th. Karamanos, G. Karagiannis, Infrared spectroscopic mapping imaging for depth analysis of artworks, Microchemical Journal, April 2020.
- M. Stefanidou, E. Tsampali, G. Karagiannis, S. Amanatiadis, A. Ioakim, S. Kassavetis, Techniques for recording self-healing efficiency and characterizing the healing products in cementitious materials, Material Design and Processing Communication, March 2020.
- C. Mpilitos, S. Amanatiadis, G. Apostolidis, Th. Zygiridis, N. Kantartzis, G. Karagiannis, Development of a Transmission Line Model for the Thickness Prediction of Thin Films via the Infrared Interference Method, MDPI Technologies 2018, 6(4), 122; https://doi.org/10.3390/technologies6040122.
- M. Stefanidou, A. Karozou, K. Matziaris, G. Karagiannis, Experimental study of the effectiveness of nano-modified protective coatings on traditional bricks,” Journal of Nanomaterials, 2015.
- D. Bikiaris, D. Alexiadis, A. Damtsios, I. Koutri, G. Karagiannis, Acoustic microscopy for real time and non-destructive analysis of tablet coating thickness, International Journal of Pharmaceutics, September 2012.
- G. Karagiannis, D. Alexiadis, A. Damtsios, G. Sergiadis, C. Salpistis Three-Dimensional “Non-destructive Sampling” of Art Objects Using Acoustic Microscopy and Time–Frequency Analysis, IEEE TRANSACTIONS ON INSTRUMENTATION AND MEASUREMENT, VOL. 60, NO. 9, SEPTEMBER 2011
- G. Karagiannis, D. Alexiadis, A. Damtsios, G. Sergiadis, C. Salpistis, Diffuse reflectance spectroscopic mapping imaging applied to art objects materials determination from 200nm up to 5000nm, Review of Scientific Instruments (RSINAK), vol. 81, issue 11, November 2010.
- G. Karagiannis, C. Salpistis, G. Sergiadis, I. Chryssoulakis, Non-destructive multi-spectral reflectoscopy between 800nm and 1900nm: An instrument for the investigation of the stratigraphy in paintings, Review of Scientific Instruments (RSINAK), vol. 78, issue 6, June 2007.
-
Related info
http://www.ormyliafoundation.gr/en/ & http://www.artdiagnosis.gr/about-us/the-lab/